Season in Review 2020–21
Indices of habitat conditions, weather, and regional duck abundance
Indices of habitat conditions, weather, and regional duck abundance
This report describes broad scale indices of habitat conditions, weather, and regional waterfowl abundance during the 202021 waterfowl hunting season. Due to cancellation of the 2020 Waterfowl Breeding Population and Habitat Survey, data on breeding population size and habitat conditions were unavailable in 2020. Precipitation patterns and field reports revealed dry conditions and likely low production in the Canadian prairies, but excellent wetland conditions and likely above average production in the U.S. prairies during 2020. By most accounts, the September teal season was one of the best on record, likely boosted by excellent production in the Dakotas. An unusually cold October triggered significant movements of birds into mid- and southern latitudes, benefitting early hunters in the south while frustrating those in the north. Subsequent mild temperatures, limited rainfall, and few snow events dominated weather patterns in the central and eastern U.S. from November to mid-January, leading to widespread reports of stale ducks and sporadic hunting success. Similar reports of early hunting success followed by mild conditions prevailed in the western U.S. Several late-January weather systems brought needed change to many regions, aiding some hunters during the final weeks of the season. Weather patterns experienced during the 202021 season were generally consistent with those expected during a La Nia year.
Indices of waterfowl abundance from the Mid-winter Waterfowl Survey were down across most states in the Central and Mississippi Flyways, with only 5 states reporting abundances notably above the recent 10-year average. Although mid-winter data do not reflect complete counts or distributions and abundances occurring during other parts of the hunting season, deviations from recent averages at mid-winter provide insights relative to previous years. Overall, widespread drier conditions in the Canadian prairies likely held 2020 continental duck production to average at best, and mild winter conditions throughout much of the central and eastern U.S. enabled birds to spread out in time and space to occupy a diversity of wetlands that remained available longer than typically expected.
Many factors influence the abundance and distribution of waterfowl during autumn-winter, some of which include temperature, snow cover, precipitation, habitat quality and quantity, fall population size (a function of breeding population and productivity), disturbance, and agricultural land use practices. These have been discussed, analyzed, and documented in numerous outlets through the years, including peer-reviewed scientific publications (Nichols et al. 1983, Schummer et al. 2010, Hagy et al. 2016) and popular magazine articles (Brasher 2019, Moorman 2019, Moorman 2020). Weather variables are among the most well studied and the only ones quantified annually within a time frame that enables timely examination of their pattern during autumn-winter and consideration of how they may have influenced waterfowl.
This review is intended to provide insights on several factors that likely influence waterfowl abundance and distribution during the non-breeding period. Among these are indices of breeding habitat conditions during the previous year, which are pivotal in determining productivity and the overall fall flight, and large-scale weather patterns and environmental conditions that developed during the 202021 waterfowl hunting season (SepJan) in the contiguous U.S. (i.e., lower 48 states). During the nonbreeding season, waterfowl movements can be southerly and northerly as well as east and west. The relative influence of environmental conditions will vary among species, across different spatial and temporal scales, and synergistically in ways that may not be fully appreciated or documented. Thus, remarks accompanying these graphics reflect large-scale, generalized patterns, and should not be interpreted as definitive assessments of either the distribution of waterfowl at specific locations or how specific conditions during 202021 may have affected them.
Also presented in this review are results from Mid-winter Waterfowl Surveys of states in the Central and Mississippi Flyways. Results are not presented for states in the Pacific and Atlantic Flyways because far fewer of their states continue to conduct Mid-winter Waterfowl Surveys. These data, obtained from state wildlife agencies, provide an index of waterfowl abundance during early January within surveyed regions of their state and are presented in this review in absolute numbers and as departures from 201120 averages. Importantly, because survey methods and spatial coverage vary among states, and many external factors influence variation around monthly survey estimates, comparisons of absolute estimates between states, or broad conclusions drawn from single year surveys, are not advised. Additionally, regional (e.g., state) waterfowl abundance is a function of continental population size and distribution of that population at the time of the survey. Thus, single-year departures from averages reflect the combined effect of these, which complicates assessments of primary drivers of those departures when viewed on a state-specific level. In contrast, comparisons among states in terms of their departures from average may yield insights to how waterfowl were distributed during early January relative to average distribution patterns in recent years. Perhaps the most important caveat, however, is that Mid-winter Waterfowl Survey results reflect indices of abundance during a relatively narrow window of time in early January and should not be viewed as indicative of abundances and distributions that may have existed before or after the mid-winter survey period.
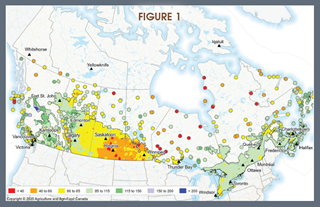
Figure 1. Percent of average precipitation for the 6 months (11/1/20194/30/2020) preceding the 2020 waterfowl breeding season in Canada. https://www.agr.gc.ca/eng/agriculture-and-the-environment/drought-watch/agroclimate-maps/?id=1463574557847
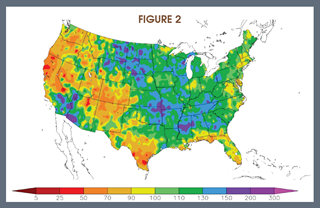
Figure 2. Percent of normal precipitation for the 12 months (5/1/20194/30/2020) preceding the 2020 waterfowl breeding season in the contiguous U.S. https://hprcc.unl.edu/maps.php?map=ACISClimateMaps
With cancellation of the 2020 Waterfowl Breeding Population and Habitat Survey, waterfowl managers entered fall 2020 lacking data on breeding population status, pond numbers, and duck settling patterns. However, insights on habitat conditions and potential productivity can be gleaned from precipitation patterns preceding the breeding season. Precipitation was 4085% below average in southern Manitoba, Saskatchewan, and eastern Alberta, which likely translated into average or below average production in the Canadian prairies. In contrast, precipitation was 110200% above average in North and South Dakota, creating exceptional wetland conditions and likely good to excellent production in the U.S. prairies. Indeed, reports of abundant blue-winged teal were consistent with these expectations.
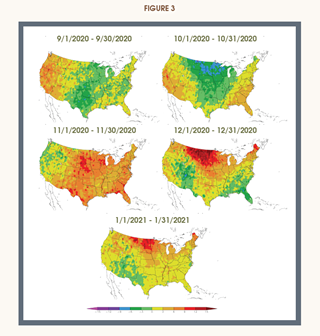
Figure 3. Average monthly temperature (F) departure from normal for the contiguous U.S., Sep 2020Jan 2021, https://hprcc.unl.edu/maps.php?map=ACISClimateMaps. Warmer colors indicate above average temperatures while cooler colors indicate below average temperatures.
Temperature patterns during the 202021 waterfowl season were a story of sharp contrasts. Following a relatively average September, October brought periods of abnormal cold to the central U.S but above average temperatures in the East and West. Based on discussions with state waterfowl biologists in the central U.S., the October cold stimulated a noticeable southward movement of birds, benefitting some hunters while frustrating those in northern latitudes that witnessed an abrupt departure of many species. Beginning in November, above average temperatures gripped areas east of the Rocky Mountains, setting the stage for a frustrating pattern of mild temperatures that persisted into mid-January. Temperatures in the Pacific Flyway were also above average during much of the 202021 season.
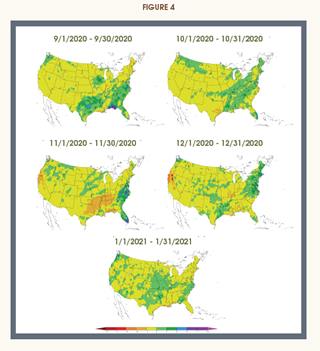
Figure 4. Total monthly precipitation (in), departure from normal for the contiguous U.S., Sep 2020Jan 2021, https://hprcc.unl.edu/maps.php?map=ACISClimateMaps. Warmer colors indicate drier than average conditions while cooler colors represent wetter than average conditions.
Precipitation patterns largely mirrored those of temperature, with rain events in the southern U.S. during September benefitting early teal hunters and creating optimism for good habitat conditions in the regular waterfowl season. However, rain events were infrequent or relatively limited in coverage in much of the U.S. beginning in November and persisting through mid-January. The lack of rain created what was described by state biologists as below average habitat conditions in much of the southern and eastern U.S. and prevented the frequent development of new habitat that typically stimulates local or regional bird movements. Relatively dry conditions also existed in much of the western U.S., at least until mid-January when a series of storms brought significant snow and rain to the region. Precipitation patterns observed during the 202021 season were largely consistent with those expected during a La Nia year.
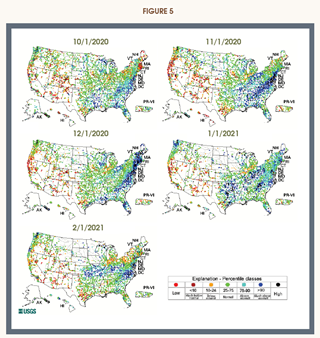
Figure 5. Daily streamflow percentiles, displayed monthly, for the contiguous U.S., Oct 2020Feb 2021. https://waterwatch.usgs.gov/index.php?id=pamap
Lower than average precipitation during the waterfowl season produced relatively low streamflow conditions, and thus limited overbank flooding, across many parts of the U.S. In regions where waterfowl habitat abundance is closely tied to overbank flooding of river systems (e.g., Arkansas), these conditions proved particularly challenging for waterfowl hunters, both in terms of fewer places to hunt and lack of new habitats to which birds often respond as they move about in search of new, higher quality foraging habitats. Due to infrequent occurrence of new habitats and above average temperatures (Figure 3), birds in many parts of the country often had no reason to deviate from the stale patterns that were described so often during the 202021 season.
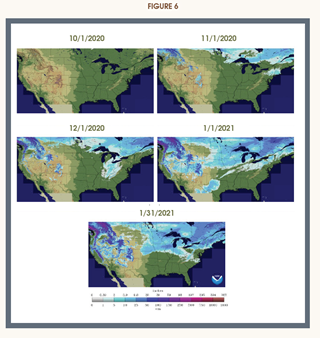
Figure 6. Daily snow depth (in), displayed monthly, for the contiguous U.S., Oct 2020Jan 2021, https://www.nohrsc.noaa.gov/nsa/.
Depth and duration of snow cover is another important weather condition affecting foraging opportunities of waterfowl species, and thus their migration and distribution during winter. The 202021 waterfowl season, at least from November through mid-January, was easily characterized as lacking significant snow events. Those that did occur were either limited in severity, spatial coverage, or duration of snow cover, as above average temperatures quickly returned and remained in control over much of the season. Not until mid-late January did widespread snow occur in the eastern U.S., although it is uncertain to what extent it influenced distributions during late January.
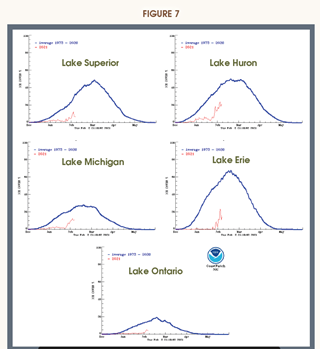
Figure 7. Winter pattern of long-term (19732020) average ice coverage (%) on the Great Lakes, compared to current year, Dec 1, 2020Feb 3, 2021. https://coastwatch.glerl.noaa.gov/statistic/statistic.html
Ice cover on the Great Lakes, measured as percent of average, provided additional evidence of the persistent mild temperatures and their influence on waterfowl habitats in the eastern U.S. On all 5 Great Lakes, ice coverage (% of total lake area) were at extreme low levels (<510%) as late as the 3rd week of January, and reports from the field confirmed the open water and lingering abundances of waterfowl, often in substantial concentrations (e.g., canvasbacks on Lake St. Clair and mallards and black ducks at Long Point, Lake Erie during mid-January).
Table 1. Mid-winter (early January 2021) Waterfowl Survey results from states in the Central Flyway expressed in absolute numbers and departures from 201120 averages.
Texas (STATE-WIDE)
Texas (COASTAL)
New Mexico
Oklahoma
Kansas
Nebraska
Colorado
Wyoming
South Dakota
Montana
North Dakota
Table 2. Mid-winter (early January 2021) Waterfowl Survey results from states in the Mississippi Flyway expressed in absolute numbers and departures from 201120 averages. Minnesota and Wisconsin not reported as they no longer conduct mid-winter surveys.
Louisiana (STATE-WIDE)
Louisiana (COASTAL)
Mississippi
Alabama
Arkansas
Missouri
Tennessee
Kentucky
Illinois
Iowa
Indiana
Ohio
Michigan
Overall, 2021 Mid-winter Waterfowl Survey numbers were down across most states in the Central and Mississippi Flyways (Tables 1 and 2). Only Colorado, Kansas, Michigan, North Dakota, and Ohio documented abundances of total ducks or mallards that were notably above their 201120 averages. However, even for those states, absolute numbers were not exceptional. Several states reported abundances that were near the lowest on record, and those occurred in southern, mid-, and northern latitude locations. Distributions or abundances observed during mid-winter should not be viewed as representative of those that would have occurred during the weeks or months before or after the survey period, as birds readily redistribute in response to local- or regional-scale habitat or environmental conditions. Additionally, mid-winter surveys capture only a fraction of all waterfowl on the landscape and should not be viewed as depictions of total winter population abundances. Deviations from 201120 averages, however, provide insight on how relative abundances and distributions during the 202021 season compared to previous years.
Noting the lack of breeding population and habitat data from 2020 and the many caveats with Mid-winter Waterfowl Survey numbers, attempts at definitive explanations for overall low numbers during mid-winter and their associated distributions are beyond the scope of this report. Nevertheless, widespread drier conditions in the Canadian prairies likely held total 2020 duck production to average at best, and milder winter conditions throughout much of the central and eastern U.S. enabled birds to spread out in time and space to occupy a diversity of wetlands that remained available longer than typically expected.
Download a PDF of Season in Review 2020-21
Share this photo
Ducks Unlimited uses cookies to enhance your browsing experience, optimize site functionality, analyze traffic, and deliver personalized advertising through third parties. By continuing to use this site, you agree to our use of cookies. View Privacy Policy