Mapping the Way for Conservation
Using cutting-edge Geographic Information Systems technology, Ducks Unlimited is harnessing the power of data to guide its work
Using cutting-edge Geographic Information Systems technology, Ducks Unlimited is harnessing the power of data to guide its work
By Jennifer Boudart
Nearly every aspect of Ducks Unlimiteds work makes use of geospatial datainformation that is geographically linked to specific locations on earth. In fact, DU has its own team of specialists who develop analytics and tools based on geospatial data from various sources. These specialists use Geographic Information Systems (GIS) technology to organize imagery and data into maps and other visual representations of landscapes that contain layers of geographically linked information.
GIS maps can display an incredible array of data, from wetland characteristics and waterfowl use to land-use practices and related ecosystem services such as water quality, carbon storage, and floodwater retention. Human geospatial data, such as the recreational activities of local citizens or their interest in conservation, can be incorporated as well. The geospatial team tailors GIS maps to fit the needs of different departments across DU, from conservation to fundraising to communications.
This technology can also be used to attract support from diverse partners, says Robb Macleod, DUs national GIS director. By using multiple data sets and showing how they intersect, we can produce a map that shows how a DU project can benefit many stakeholders. For example, capturing water quality data in a GIS map for a proposed project may help to leverage funding from organizations that may not be interested in wetland conservation but that do care about clean water.
Following are some of the GIS-based products that are useful not only to DU but also to its partner agencies and organizations as well as public users who access the geospatial teams open data portal.
The geospatial team got its start in 1984, when DU received funding from NASA to produce the first-ever wetland inventory of the Prairie Pothole Region. GIS specialists obtained imagery from the US Landsat Thematic Mapper satellite and developed a proprietary software system for classifying the images into wetland maps. The project was completed in 1992, and the resulting maps were quickly put to use by DUs Great Plains Regional Office, DU Canada, and partnering agencies to plan and deliver conservation work on the prairies.
Today, the geospatial team continues to generate wetland inventory maps. These maps are integrated into national efforts like the US Fish and Wildlife Services National Wetland Inventory (NWI) and the Canadian Wetland Inventory. In fact, DU is currently helping to update the NWI to make it more accurate and comprehensive. Much of the imagery is 20 to 30 years old; original maps were created by hand-drawing wetland boundaries on plastic sheets affixed to hard copies of aerial photos. DUs geospatial team is in the process of creating new high-quality digital wetland maps for all 50 states. While the team can make use of GIS technology and high-resolution digital images, much of the work must still be done manually. Boundaries of a given wetland are added to the computer image using a mouse or a stylus. GIS staff and interns manually classify each wetland as well. It is slow work, but efforts are under way to automate more of the process.
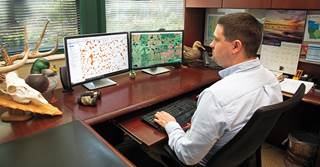
Photo John Hoffman, DU
DU is also helping enhance NWI data as part of the update. In addition to identifying the locations of wetlands, the associated ecosystem services that wetlands provide are being identified too. For example, DU is working with the Mississippi Band of Choctaw Indians (MBCI) in conjunction with the US Fish and Wildlife Service to update all NWI data for the watershed in its tribal lands. DU is also assessing ecosystem services provided by each wetland to help the tribe identify which are most critical to protect as the MBCI expands housing. This additional work will also be incorporated into the NWI.
GIS maps are the basis for a variety of decision support tools that help DU and its partners visualize different scenarios and predict different conservation outcomes. These interactive models are designed to be used without the need for GIS expertise. Biologists and lay people can change different parameters in these models to get different results based on local scientific knowledge. This allows users to refine the models to meet their own particular needs, Macleod says.
He cites as an example a decision support tool being developed for use in the Montezuma Wetlands Complex in Seneca County, New York. Montezuma covers more than 50,000 acres and is one of the premier wetland areas in the eastern United States. DU is one of the partners involved in the Montezuma Wetlands Complex Land Protection Strategic Plan.
Weve been working with federal agency partners as well as local nonprofit land trusts to develop a decision support tool that helps prioritize private land parcels that stakeholders may want to protect in the future, Macleod says. This tool allows properties to be ranked for protection based on multiple data layers, including the presence of wetlands and their size; past and present wetland characteristics; potential for restoration; land uses; land ownership and landowner interest; and the proximity of each parcel to existing protected lands.
Another way in which the geospatial team supports DUs mission is by sharing important messages through story mapsinteractive web pages that incorporate maps, photos, text, and other multimedia content. These immersive graphics can be used in marketing materials, project proposals, and fundraising programs. They may display information about completed projects, specific ongoing programs, or places where DU has positively impacted landscapes, wildlife, and people through its work. A story map is a highly visual way of displaying all these components in a format that is user friendly and that does not require any knowledge of GIS, Macleod says.
The team also provides GIS analysis to help leverage donor support. We get funding from corporate sponsors who really want to do work in areas where they operate, Macleod says. If a corporation has offices or plants in five different states, we can use GIS analysis to display these various locations and layer in data that show all the projects DU has completed in these areas as well as projects we have planned. We can suggest conservation opportunities that will be most impactful for that corporate sponsor and for us.
Likewise, the geospatial team can help identify potential areas where membership or fundraising activities can be bolstered to garner additional support for conservation. We can display where all our fundraising events take place throughout the United States and identify areas where there might be a gap, Macleod says. Then, we can gather information on duck stamp sales to identify areas where such sales are strong but we dont have a local chapter or event nearby. Those can be prime places for us to establish a new chapter or event.
Thanks to the geospatial team, DU staff have a powerful array of tools that they can use to help maximize resources and focus conservation efforts where they will have the greatest impact. And thanks to advances in geospatial sciences, we are doing things weve never been able to do before, Macleod adds. The potential for this technology is almost limitless.
Share this photo
Ducks Unlimited uses cookies to enhance your browsing experience, optimize site functionality, analyze traffic, and deliver personalized advertising through third parties. By continuing to use this site, you agree to our use of cookies. View Privacy Policy